China Glass Packaging Industry Import & Export Report Jan-Apr 2026: Steady Trade Growth with Clear Structural Differentiation
Official import and export statistics for China glass packaging industry covering January to April 2026 have been officially released. The report covers three core dimensions: overall trade scale, product category structure and global regional distribution, presenting a comprehensive picture of the industry’s foreign trade performance since the start of the year. This article systematically organizes the official glass packaging import export data and supplements it with operational data from leading foreign trade enterprise Xiamen Upc Imp & Exp Co., Ltd. as a micro sample comparison, intuitively demonstrating the growth gap between the industry average and individual enterprise performance for glass container export practitioners.
1. Overall Trade Performance: Cumulative Growth with Short-Term Fluctuation in April
From January to April 2026, China glass packaging export and import maintained positive overall growth, with total industry trade exceeding $1 billion. Affected by seasonal factors and order cycles, exports saw a phased decline in April, while imports continued their strong growth momentum.
|
Indicator |
April Value (USD 10,000) |
April YoY Change |
Jan-Apr Cumulative Value (USD 10,000) |
Jan-Apr YoY Change |
|
Total Import & Export Value |
17779.58 |
-33.26% |
102906.82 |
5.74% |
|
Total Export Value |
17121.39 |
-34.68% |
100411.55 |
5.12% |
|
Total Import Value |
658.19 |
52.87% |
2495.27 |
38.72% |
|
Net Export Value |
16463.21 |
-36.14% |
97916.29 |
4.48% |
Exports dominate China’s glass packaging trade, accounting for 97.57% of total trade value in Jan-Apr, with a trade surplus of $979.16 million, consolidating China’s position as the world’s core glass bottle exporter. Although imports are smaller in scale, their growth rate significantly outpaces exports, reflecting rapidly rising domestic demand for high-end and specialty glass packaging containers.
2. Product Structure: Divergent Export Growth, High-End Import Boom
Export Products: Large-Capacity Categories Lead Growth
The glass container export market shows clear structural differentiation. Medium and large-capacity glass containers and small sealed glass containers containers have become core growth drivers, while small-capacity containers underpin the industry’s fundamental market with their large base.
|
Product Category (HS Code) |
April Export Value (USD 10,000) |
April YoY |
Jan-Apr Export Value (USD 10,000) |
Jan-Apr YoY |
|
Glass containers ≤0.15L (70109090) |
10166.35 |
-39.03% |
62792.88 |
4.00% |
|
Glass containers 0.15L–0.33L (70109030) |
1697.17 |
-37.41% |
9377.64 |
-1.80% |
|
Glass containers 0.33L–1L (70109020) |
4370.51 |
-21.96% |
23135.56 |
10.03% |
|
Glass containers >1L (70109010) |
588.55 |
-30.73% |
3579.48 |
9.78% |
|
Glass small sealed glass containers (70101000) |
298.81 |
-20.32% |
1525.99 |
17.36% |
Cumulative data shows small-capacity containers (≤0.15L) remain the largest export category, accounting for 62.5% of total exports. small sealed glass containers export leads all categories with 17.36% YoY growth, while 0.33L–1L and >1L containers both achieve nearly 10% growth, serving as the core drivers of export expansion.
Import Products: Explosive Growth in Specialty High-End Categories
The high-end characteristic of imports is more prominent. The growth rate of small sealed glass containers containers small sealed glass containers and mid-to-high-end containers far exceeds the average level, and there is still considerable room for import substitution of domestic high-end glass packaging.
|
Product Category (HS Code) |
April Import Value (USD 10,000) |
April YoY |
Jan-Apr Import Value (USD 10,000) |
Jan-Apr YoY |
|
Glass containers ≤0.15L (70109090) |
544.08 |
82.07% |
1920.96 |
41.59% |
|
Glass containers 0.15L–0.33L (70109030) |
12.30 |
-67.65% |
85.44 |
15.32% |
|
Glass containers 0.33L–1L (70109020) |
48.22 |
-0.73% |
264.01 |
52.60% |
|
Glass containers >1L (70109010) |
45.35 |
22.05% |
177.72 |
1.89% |
|
Glass small sealed glass containers (70101000) |
8.23 |
3.68% |
47.13 |
129.54% |
In Jan-Apr, imports of glass small sealed glass containers skyrocketed 129.54% YoY, imports of 0.33L–1L containers grew 52.60% YoY, and small-capacity basic container imports also maintained over 40% growth, reflecting sustained upward demand for high-quality glass packaging containers in domestic small sealed glass containers containers, high-end daily chemical and other sectors.
3. Global Regional Landscape: Diversified Export Markets, Imports Concentrated in Developed Economies
Export Regions: US Remains Top Destination, Emerging Markets Show Strong Growth
The glass packaging foreign trade export market presents a pattern of “one superpower and multiple strong players”. The United States is the single largest export destination, with diversified development in Southeast Asia, the Middle East, Europe and America. Some emerging markets have achieved outstanding growth rates.
|
Rank |
Country/Region |
April Export Value (USD 10,000) |
April YoY |
Jan-Apr Export Value (USD 10,000) |
Jan-Apr YoY |
|
1 |
United States |
3130.78 |
-12.69% |
15119.63 |
-4.69% |
|
2 |
UAE |
– |
– |
5664.42 |
-14.60% |
|
3 |
Indonesia |
1006.82 |
-5.12% |
5091.56 |
24.81% |
|
4 |
Vietnam |
770.80 |
-29.70% |
4542.37 |
9.60% |
|
5 |
Canada |
811.81 |
-20.10% |
4225.71 |
1.65% |
|
6 |
Philippines |
652.62 |
-41.18% |
3806.78 |
15.64% |
|
7 |
Saudi Arabia |
– |
– |
3369.09 |
-11.44% |
|
8 |
South Korea |
550.46 |
-14.35% |
3180.63 |
35.94% |
|
9 |
India |
687.16 |
23.45% |
2943.61 |
18.27% |
|
10 |
Malaysia |
– |
– |
2563.65 |
1.49% |
In Jan-Apr, the United States ranked first with $151.20 million in exports. Southeast Asian markets delivered strong growth momentum, with Indonesia, South Korea, the Philippines and India all achieving double-digit growth. The Middle East market maintains a large scale but sees a year-on-year decline, with its market structure undergoing adjustment.
Import Regions: Europe and Japan Dominate, Some Countries See Explosive Growth
Import sources are highly concentrated in developed manufacturing countries, with European countries occupying a core position. Meanwhile, some emerging import source countries have experienced explosive growth.
|
Rank |
Country/Region |
April Import Value (USD 10,000) |
April YoY |
Jan-Apr Import Value (USD 10,000) |
Jan-Apr YoY |
|
1 |
Italy |
112.66 |
53.45% |
359.02 |
0.37% |
|
2 |
Japan |
71.79 |
-12.21% |
324.57 |
-10.63% |
|
3 |
Switzerland |
102.13 |
66045.01% |
323.69 |
1089.13% |
|
4 |
Germany |
93.66 |
53.79% |
298.62 |
25.95% |
|
5 |
Thailand |
27.71 |
53.73% |
154.13 |
148.99% |
|
6 |
Taiwan, China |
40.12 |
-6.97% |
151.92 |
10.93% |
|
7 |
United States |
43.26 |
22.16% |
135.98 |
47.40% |
|
8 |
France |
27.38 |
-46.59% |
127.78 |
3.09% |
|
9 |
Hungary |
49.79 |
100% |
104.32 |
253.51% |
|
10 |
Poland |
– |
– |
102.95 |
2959.81% |
Italy, Japan and Switzerland rank top three import sources, together accounting for over 40% of total imports. Countries such as Switzerland, Poland and Hungary have seen multiple or even dozens of times year-on-year growth in import value, reflecting the gradual diversification of domestic import procurement channels.
4. Industry Average vs. Xiamen Upc Performance Comparison
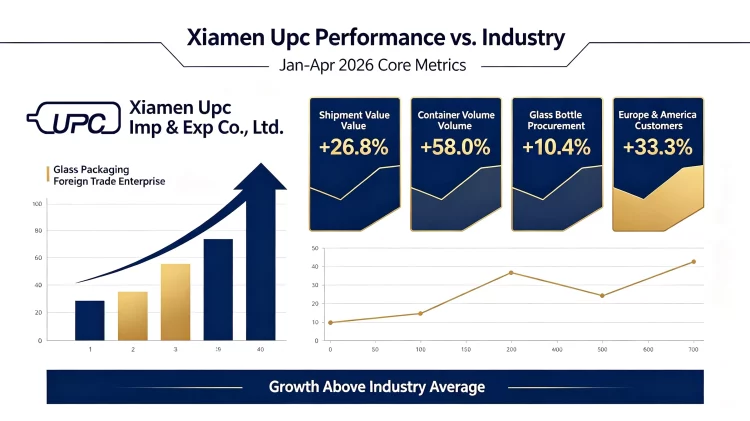
As a representative glass packaging supplier in Xiamen, Xiamen Upc Imp & Exp Co., Ltd. core operating data for Jan-Apr 2026 is as follows, forming an intuitive comparison with the overall industry growth:
|
Item |
Jan-Apr 2026 |
Jan-Apr 2025 |
|
Glass Bottle Procurement Volume |
~74.598 million units |
~67.545 million units |
|
Cap & Accessory Procurement (iron/aluminum/spray/wood caps) |
~37.487 million units |
~41.6832 million units |
|
Other Products (cartons, pallets, labels, aluminum cans, etc.) |
~23.4097 million units |
~52.655 million units |
|
Shipment Containers (mixed sizes) |
779 containers |
493 containers |
|
Total Shipment Value |
USD 11.7401 million |
USD 9.2601 million |
|
European & American Customers |
16 |
12 |
|
Asian Customers |
28 |
28 |
|
African Customers |
10 |
7 |
|
Oceania Customers |
4 |
3 |
Compared with the industry’s overall export growth rate of 5.12%, Xiamen Upc has achieved substantial growth in both shipment value and container volume. The number of customers in Europe, America, Africa and Oceania continues to expand, and its business growth momentum is significantly higher than the industry average, reflecting the leading advantages of head enterprises in the steady growth cycle of the glass packaging industry.
中国1-4月数据与公司图片对比新闻(含SEO优化)
Market Outlook
Overall, China glass packaging import export presents the characteristics of “steady total volume growth, optimized structure and regional differentiation” since the start of 2026. Leading enterprises, relying on supply chain advantages and global layout, significantly outperform the industry in growth rate. Looking ahead, the glass container export sector is expected to maintain sustained growth driven by recovering global demand and ongoing product high-end upgrading.